
Das sind die TRENDING NEWS des Tages!
Du willst Zugang zu allen Infos?
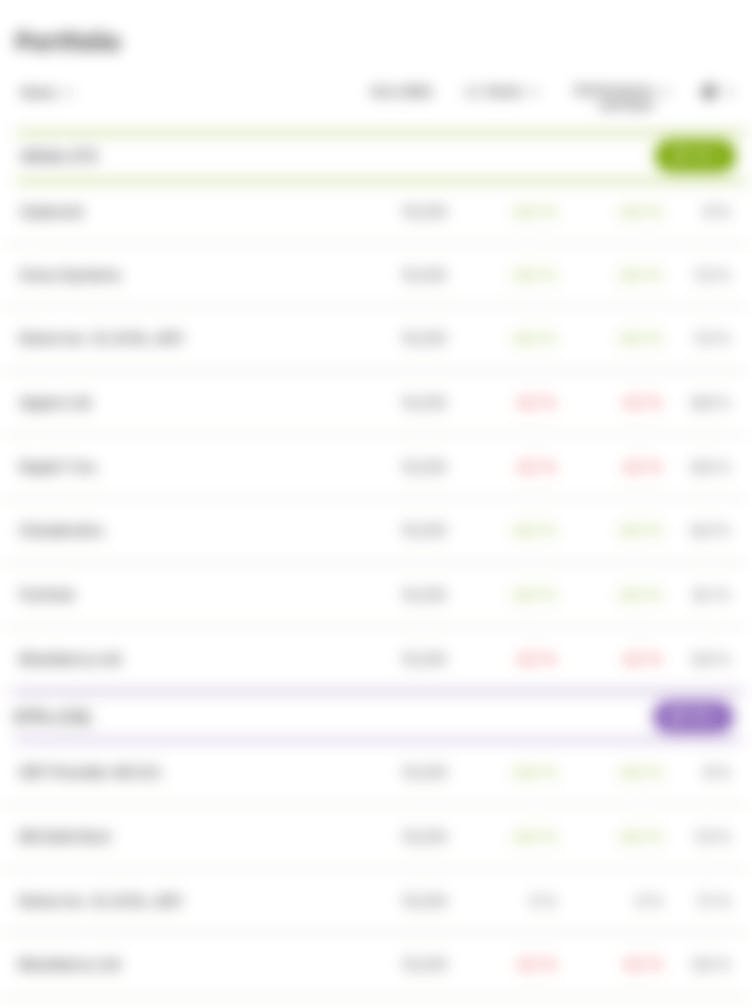
Um das aktuelle Portfolio dieses wikifolios, den wikifolio Chart, alle Kennzahlen und bisherigen Trades zu sehen, registriere dich jetzt – völlig kostenlos.
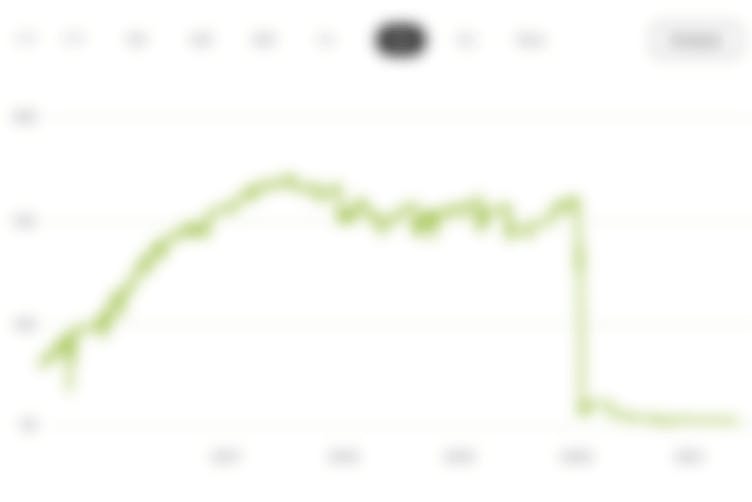
Portfolio Chart
DetailsMerkmale
Feed
Handelsidee
This is my monthly momentum trading system and is like my other wikifolios purely technical. So there won't be any second guessing or emotions involved. Momentum is a well researched market anomaly which was used e.g. by Jesse Livermore and is researched by many academics (see research papers on SSRN by Jegadeesh, Titman etc.). Like every sound trading system this wikifolio is made for long-term investments and is no get-rich-quick-scheme. The System we use here is based on researches of Gary Antonacci (see Dual Momentum Investing). Our universe are ETF's only. I'm going to use a self-programmed program which calculates the momentum score for each of our traded assets and then decides whether we are invested in stocks or in bonds. My own backtest of this system delivered the following results for the years between 2000 - 2020: CAGR: 7.6 % Max. Drawdown: -22.02 % Volatility (monthly): 3.34% Volatility (annualized): 11.57% Sharpe Ratio: 0.54 Sortino Ratio: 0.78 Extended backtests and monthly results of a similar strategy can be found on Gary's website.
Stammdaten
WF02020MMS
22.07.2020
-
167,2
Anlageuniversum
Du willst Zugang zu allen Infos?
Um das aktuelle Portfolio dieses wikifolios, den wikifolio Chart, alle Kennzahlen und bisherigen Trades zu sehen, registriere dich jetzt – völlig kostenlos.
Informationen zur Zusammensetzung des fiktiven Referenzportfolios findest du hier.