Mittelstand weltweit langfristig
User deleted
Last Login: 11/29/2019
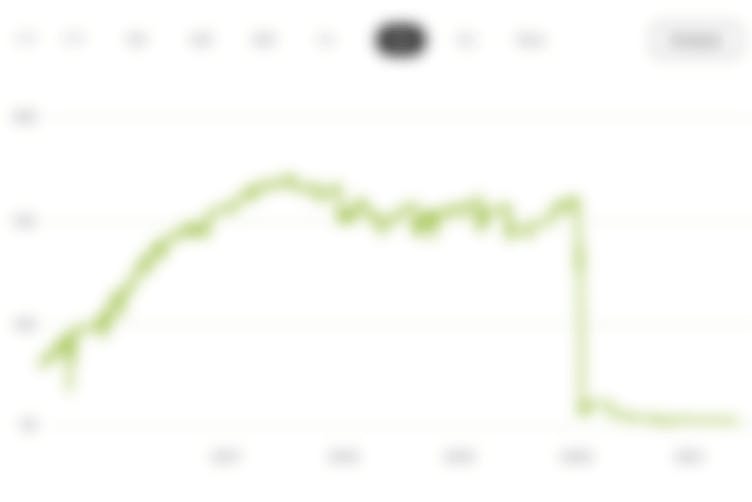
Portfolio chart
DetailsTags
Feed
Trading Idea
Das wikifolio bildet - soweit möglich - das Depot des UPAC-Investmentclubs nach (540% Rendite seit Start 2009). Es enthält die im Lang & Schwarz-Anlageuniversum handelbaren großen UPAC-Kernpositionen. Den kompletten UPAC-Track-Record und detaillierte Informationen zur Anlagestrategie finden Sie auf der Homepage des Investmentclubs www.upac.de. 2009: UPAC Invest: + 86% UPAC Wikifolio: n.a. 2010: UPAC Invest: + 27% UPAC Wikifolio: n.a. 2011: UPAC Invest: - 31% UPAC Wikifolio: n.a. 2012: UPAC Invest: + 48% UPAC Wikifolio: - 5% 2013: UPAC Invest: + 83% UPAC Wikifolio: + 5% 2014: UPAC Invest: + 14% UPAC Wikifolio: +16% 2015: UPAC Invest: - 6% UPAC Wikifolio: -26% 2016: UPAC Invest: +12% UPAC Wikifolio: +4% 2017: UPAC Invest: +21% UPAC Wikifolio: +20% 2018: UPAC Invest: -13%. UPAC Wikifolio: -30% 2019: UPAC Invest: +2%. UPAC Wikifolio: +8% Summe UPAC Invest +455% Summe UPAC Wikifolio -21% (Stand 17.01.2019) UPAC ist einer von über 7.000 Investmentclubs in Deutschland. Die Gesellschaft ist gemessen am Anlagevolumen ein Club mittlerer Größe. UPAC investiert weltweit in Mittelstandsunternehmen mit hervorragenden Geschäftsaussichten. Primäres Ziel ist es, messbare Unternehmenswerte wie Umsatz, Gewinn und Buchwert fortwährend pro UPAC-Anteil zu steigern. Hierfür hält UPAC Unternehmen in starken Wachstumsphasen und nimmt Depotumschichtungen zur richtigen Zeit vor. Die Ermittlung der Unternehmenswerte erfolgt anhand der Quartals- und Jahresberichte. Die Entwicklung der wichtigsten Zahlen kann wochenaktuell auf der Homepage mitverfolgt werden. Aktienkurse folgen mittel- und langfristig immer realen Unternehmenswerten.
This content is not available in the current language.
Master data
WF12481632
11/14/2012
-
88.6