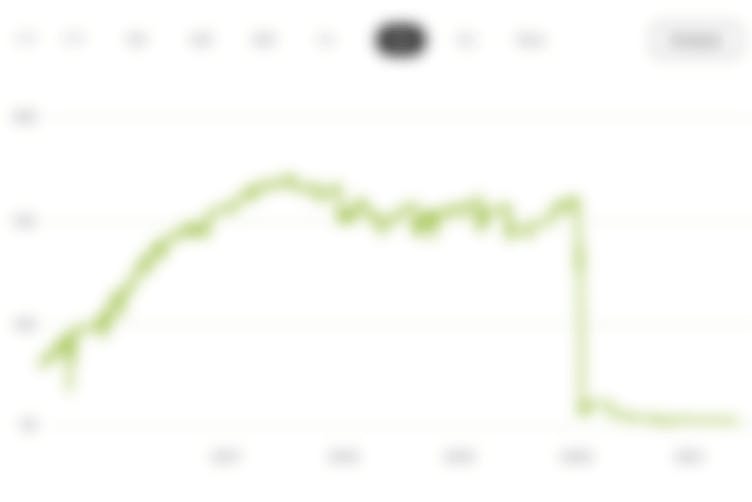
+41.0%
since 10/16/2020
+10.6%
Ø-Perf. per year
+10.6%
Performance (1yr)
22.9%
Volatility (1yr)
0.3
Return/Risk
Portfolio chart
DetailsFeed
Trading Idea
Buying stocks and ETFs that went through a crisis but have the perspective of future revenues. It will also include some growth stocks and ETFs. The evaluation is based on the financial reporting of the companies as well as current news and media.
Master data
Symbol
WF00JK0402
Date created
10/16/2020
Index level
-
High watermark
154.5