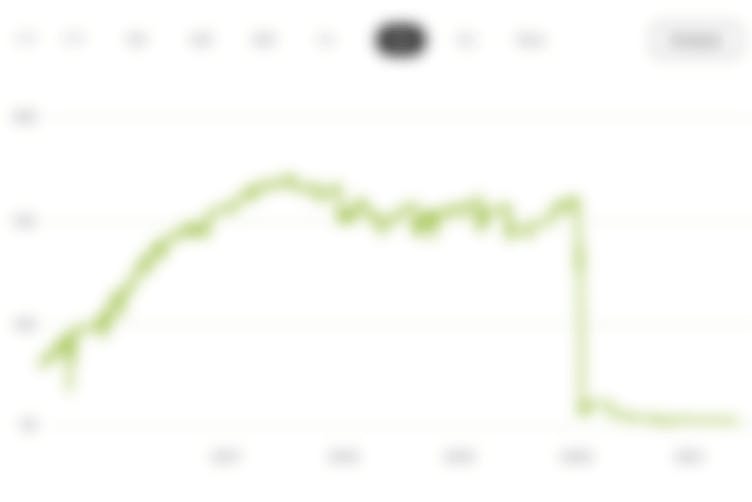
Portfolio chart
DetailsTags
Feed
Trading Idea
Elliot waves are used when trading. An acceptable chart is found using the search (this can take a very long time before thousands of charts are reviewed worldwide). Only waves and fundamental analysis have an impact on decision making which chart to choose. The trading style is with a medium and long-term perspective (short-term movements are not caught,not paying attention to any significant people’s opinions and to any news that is not understandable and logical). Bollinger bands are used with stocks and sometimes with currencies, a turnover indicator (it is not possible to do this with currencies, so sometimes I use MACD, RSI, but the indicators only as an absolutely auxiliary tool, which has an advisory role at best.) Stocks are used for daily trade,accumulation distribution, cash flow and real turnover on the exchange. I would like to emphasize that indicators are only supporting means which have no influence on decision making. I. Eliot waves II. Price action III. Fundamental analysis: the following criteria are assessed: 1.High (low) Altman score 2. Basic and chain net profit growth 3. Du Pont ROE score must be not less (above) 10 percent. 4. Low (high) p /e score 5. A company pays dividends, 6. Profit margin 7. Free cash flow, 6.D / E 9. Basic and chain growth rates of stockholders equity. IV. Bollinger bands and accompanying indicators already mentioned (in the case they are stocks) Every effort is always made to make all four points match and look like from a textbook. If it is the currency, then the first and the second points are important. The entry point is found by the technique found during tests and discoveries. Before entering into a deal, there is always a plan how it will be handled in any situation and it is not changed (the statistical model of eight years of trading experience shows that this is the best strategy).
Master data
WF0ROSALFA
11/03/2020
-
80.3