+6.2%
since 9/1/2020
+0.7%
Ø-Perf. per year
+36.4%
Performance (1yr)
23.5%
Volatility (1yr)
0.1
Return/Risk
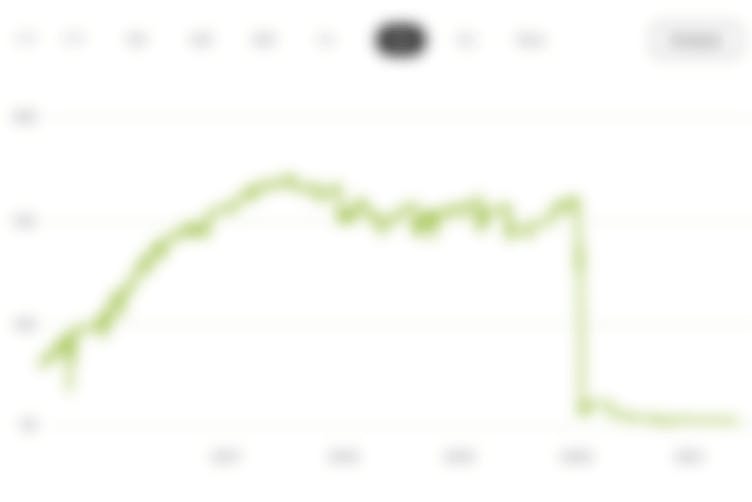
Portfolio chart
DetailsTags
Feed
Trading Idea
Longterm growth stock that outperform S&P 500 no more than 10 stocks Fundamentals: Strong EPS growth yearaly and quarterly, high margins, sales and ROE Chart: buy when forming a handle with cup Focus: mainly US tech stocks
This content is not available in the current language.
Master data
Symbol
WFLNGTRM10
Date created
09/01/2020
Index level
-
High watermark
112.8