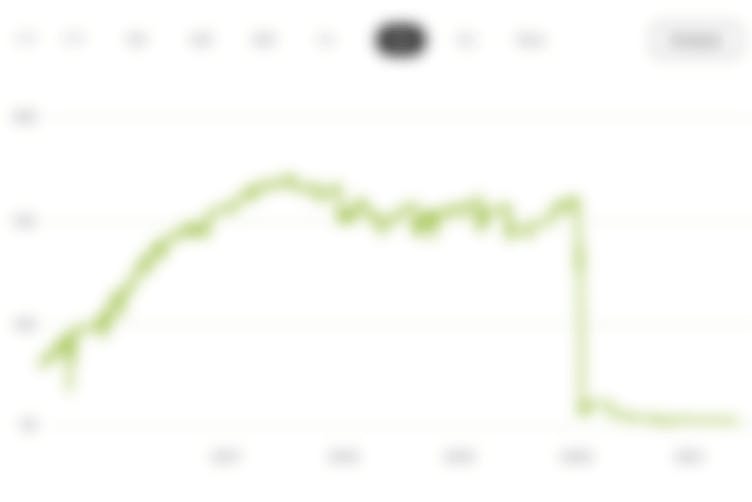
+11.8%
since 8/9/2021
+4.2%
Ø-Perf. per year
+19.8%
Performance (1yr)
14.3%
Volatility (1yr)
0.2
Return/Risk
Portfolio chart
DetailsTags
Feed
Trading Idea
This wikifolio may be composed of north american companies. The analysis of the volatility present in the market and in individual values may be the basis for decisions to act and the optimal time to act. This probability analysis is carried out on the basis of various volatility indicators with the aid of quantitative models. In my opinion, by understanding volatility, it is possible to identify attractive investment opportunities and at the same time limit the risk of loss.
Master data
Symbol
WFVOLA2021
Date created
08/09/2021
Index level
-
High watermark
116.4