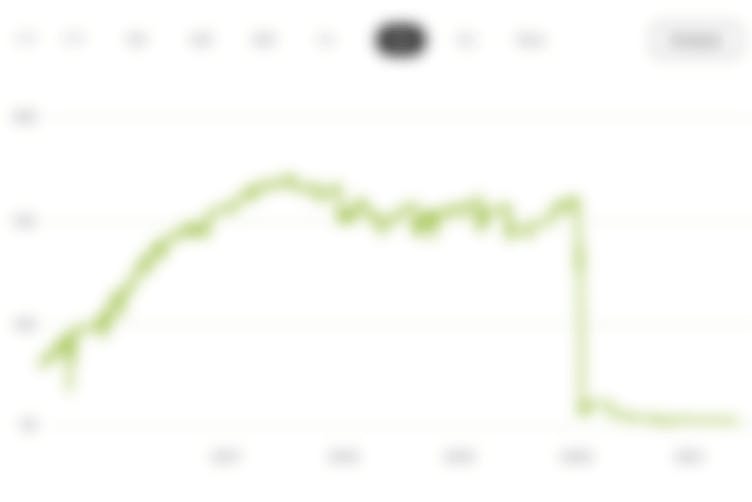
+56.8%
since 11/14/2018
+8.6%
Ø-Perf. per year
+4.5%
Performance (1yr)
6.1%
Volatility (1yr)
0.3
Return/Risk
Portfolio chart
DetailsTags
Feed
Trading Idea
Among the companies with a low PEG level, the quantitative system will pick the 10 stocks with the highest profitability. This is calculated through a ranking system that includes six different metrics: return on investment (ROI), return on assets (ROA), return on equity (ROE), gross profit margin, operating margin, and free cash flow margin. Leaving the mathematical details aside, the main rationale behind the system is quite straightforward and easy to understand. It begins by looking for companies with low PEG ratios. Once you have a list of companies that are attractively valued in terms of the PEG ratio, it makes sense to pick the most profitable companies from such a universe to build a portfolio.
Master data
Symbol
WF00LB1337
Date created
11/14/2018
Index level
-
High watermark
158.3