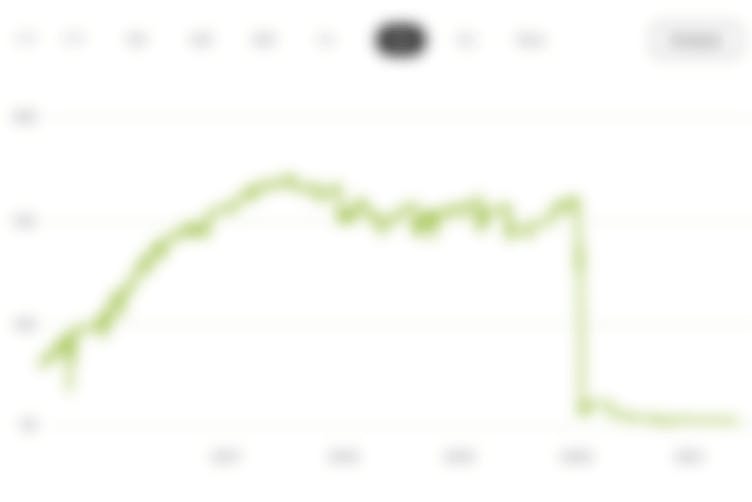
Skip to content
Register

European Equity Sharpe Ratio

MNFinance

Last Login: 04/21/2022


Overview
News
Trading idea
Portfolio
Key figures
Trades
blank

You want access to all the information?

To see the current portfolio of this wikifolio, the wikifolio chart, all key figures and previous trades, register now - completely free of charge.

RegisterLogin
+7.3%
since 10/22/2021

+2.9%
Ø-Perf. per year

+12.6%
Performance (1yr)

12.8%
Volatility (1yr)

0.2
Return/Risk


Portfolio chart

Details

Feed

Trading Idea

The European Equity Sharpe Ratio Portfolio is based on a mathematical Sharpe Ratio approach. This represents the most efficient portfolio from a return and risk perspective in the theory of the "Capital Asset Pricing Model". The investment universe for the allocation model consists of the 19 sub-indices of the EUROSTOXX 600. The allocation period of the securities is 10 trading days. On the allocation day, the new weights are reallocated based on the closing prices of the previous 20 trading days in the Sharpe Ratio Model. Since the allocation signal can only be given by the model in the evening, the new weights are implemented on the market the following trading day at new prices. Through the quantitative strategy, human errors in the investment process should be minimized. Benchmark for performance comparison of the European Equity Sharpe Ratio1 Portfolio is the EUROSTOXX 600, which should be outperformed by the strategy.

Master data

Symbol

WFQEESR001

Date created

10/22/2021

Index level

-

High watermark

107.6

Investment Universe

blank

You want access to all the information?

To see the current portfolio of this wikifolio, the wikifolio chart, all key figures and previous trades, register now - completely free of charge.

For the composition of the virtual portfolio click here.

More top wikifolios

CETAN - Bearish and Puts only

Martin Strack

+33.5%
Ø-Perf. per year

Zinsfuß

Stefan Heizmann

+14.2%
Ø-Perf. per year

TanTeo Torpedo Invest

Holger Heidhof

+65.2%
Ø-Perf. per year

Spezialwerte

Thomas Dittmer

+12.3%
Ø-Perf. per year

SmallCap Dividende Plus

Michel Tesmar

+11.2%
Ø-Perf. per year

Multi-Asset Allokation

Philipp Weller

+27.8%
Ø-Perf. per year

90 Prozent von Allem

Dirk Oede

+32.2%
Ø-Perf. per year

Value meets Momentum

Thomas Spier

+18.9%
Ø-Perf. per year

MAI Energy Selection

Robert Zschorlich

+53.0%
Ø-Perf. per year
Discover
  • Current wikifolios
  • Investment trends
  • wikifolio traders

+49 (0) 211 247 907 70service@wikifolio.com
GTCImprintData protectionCookie declaration
2024 © wikifolio Financial Technologies AG