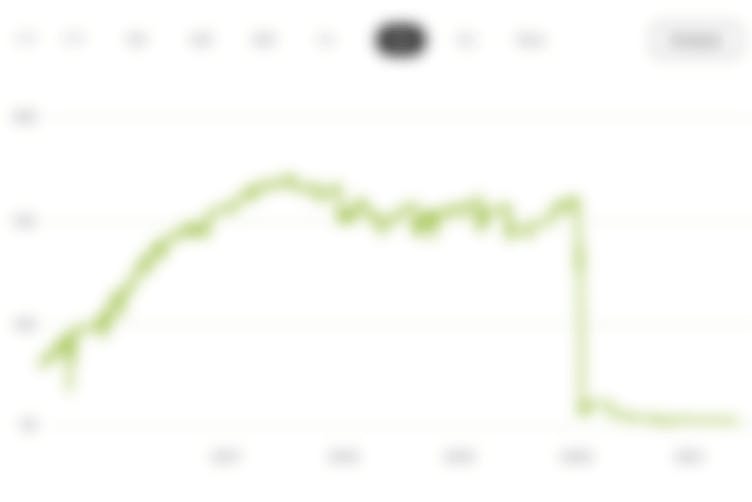
+66.9%
since 11/17/2020
+16.1%
Ø-Perf. per year
-8.1%
Performance (1yr)
7.1%
Volatility (1yr)
0.2
Return/Risk
Portfolio chart
DetailsTags
Feed
Trading Idea
Price to free cash flow is an equity valuation metric that indicates a company's ability to generate additional revenues. It is calculated by dividing its market capitalization by free cash flow values. A lower value for price to free cash flow indicates that the company is undervalued and its stock is relatively cheap. A higher value for price to free cash flow indicates an overvalued company.
Master data
Symbol
WFJOLITRIC
Date created
11/17/2020
Index level
-
High watermark
176.5