

Fear of Missing Out at OHB
| # | Name | Performance 7 Days |
|---|---|---|
| 1 | 15.45% | |
| 2 | 8.60% | |
| 3 | 6.89% | |
| 4 | 6.90% | |
| 5 | 9.84% |
The Bremen-based space company has been through extraordinary times: speculation about satellite contracts worth billions of euros for the German armed forces, rising European space spending and expectations surrounding ’s IPO drove its share price from €65 in autumn 2025 to €685 by May. The stock then came under pressure from its high valuation, a capital increase of around €500 million, the partial exit of major shareholder KKR at a significantly lower share price, and the broader correction in space stocks. As a result, the share price fell back to around €160 in less than three months.
Last week, the share price rose 6.9 % to €207. On Monday, subsidiary OHB System received a contract from the European Space Agency (ESA) for studies on the planned OASIS lunar research infrastructure. Analysts are mostly optimistic. In mid-October, NuWays reiterated its Buy recommendation with a price target of €340, pointing to potential additional contracts from the German armed forces. Berenberg sees the stock at €358, while has a target of €300. , by contrast, rates OHB “Neutral” with a price target of €250. The consensus price target is just over €300, around 45 % above the current share price.
Torsten Maus built a new position in several tranches over the course of last week for his wikifolio TREND-SURFER. The stock still has a relatively small weighting in the portfolio, which currently contains 16 holdings, and the trader also has a 40 % cash reserve. Maus uses a trend-following approach optimised for different market phases, primarily buying stocks that show relative strength and reach new price highs as trading volume increases. OHB is a somewhat different case. Here, his aim is probably closer to identifying market trends early in order to achieve high medium-term gains with individual stocks. Since the beginning of 2019, the trader has achieved an annual share-price gain of just over 11 % (127 % in total), with a moderate maximum loss of just over 18 %. A new record high was reached at the end of May; a correction has been under way since then.
Chart
Buying the Dip at Nebius Group
| # | Name | Performance 7 Days |
|---|---|---|
| 1 | -15.82% | |
| 2 | -8.24% | |
| 3 | -5.58% | |
| 4 | -23.70% | |
| 5 | -5.86% |
shares lost 5.6 % last week. The Dutch company builds data centres and leases high-performance AI computing capacity to businesses. The necessary expansion requires billions in investment, making access to external financing a key factor. On Thursday, Nebius announced a $3.5 billion secured credit facility from . The company intends to use it to finance additional data-centre capacity and give itself room to continue expanding from 2027 onwards. The financing supplements customer prepayments and operating cash inflows.
A day earlier, Piper Sandler had cut its price target from $237 to $185 while maintaining its Neutral rating. The firm lowered its valuation assumptions for AI cloud providers because of high investment levels, uncertain returns on capital and funding requirements. , by contrast, reiterated its Buy recommendation with a price target of $310. The stock is still up 90 % since the beginning of the year, but has lost almost half its value since its June high. Some wikifolio traders see this as an opportunity to enter.
Ronny Böhnisch had sold part of his Nebius shares in his wikifolio Investments Long und Short just under two weeks ago, when the share price was around €180, but has recently increased the position again through three purchases. He paid an average of only around €151. The trader takes a fairly flexible approach to stock-market trading, drawing on technical analysis and assessments of company-specific and global fundamentals. The portfolio is currently just over 70 % invested. The wikifolio will turn four in November and has delivered a total return of 69 %. Its annualised return is therefore just over 14 %, and its share price has risen 20 % since the beginning of the year. The maximum drawdown is 26 %.
Chart
Taking Profits at MongoDB
| # | Name | Performance 7 Days |
|---|---|---|
| 1 | 5.45% | |
| 2 | 5.74% | |
| 3 | 6.73% | |
| 4 | 6.28% | |
| 5 | 10.75% |
shares rose 10.7 % last week. The strongest gains came on Tuesday and Wednesday. A sharper decline followed on Thursday before the stock recovered on Friday. The US company develops database software that allows businesses to store large amounts of different types of data and make them available for applications. On Tuesday, MongoDB unveiled new open-source templates for AI agents. These can, for example, evaluate database alerts, analyse slow queries and retrieve information about data structures. The templates use the Atlas cloud platform and are intended to make it easier to set up such automations.
The stock has been highly volatile this year and is down 11 % overall. Several wikifolio traders used the recent rally to exit. On Thursday, Marcel Zschörnig removed MongoDB from his wikifolio Wachstumsaktien Weltweit MS, realising a share-price gain of 39 %. “The stock is in the upper quarter of a pronounced sideways phase and is probably valued very highly. That is why I am taking the profits for the wikifolio,” the trader wrote in explanation. Zschörnig has been active in the stock market since 2012, monitors the markets daily and runs his own podcast. For his wikifolio, he specialises in identifying disruptive and fast-growing companies around the world at an early stage. He considers both fundamental and chart-based indicators when selecting stocks. The model portfolio, launched in early 2019, is currently up 311 %. Its value has therefore increased by an average of just over 20 % per year. The maximum loss to date has been around 51 %. The wikifolio is currently trading only slightly below its all-time high.
Chart
Jumping the Ship at Moderna
| # | Name | Performance 7 Days |
|---|---|---|
| 1 | -7.22% | |
| 2 | -5.46% | |
| 3 | -20.81% | |
| 4 | -7.90% | |
| 5 | -6.02% |
With a weekly loss of 7.2 %, biotechnology company was among the weaker stocks. On Thursday, its share price temporarily plunged by around 25 %. The trigger was the release of details from a Phase III trial of a personalised cancer vaccine being developed by Moderna together with . In the study of more than 1,100 skin cancer patients, the combination of the vaccine Intismeran and the immunotherapy Keytruda was reported to have reduced the risk of relapse or death by 42 %. The risk of distant metastases or death reportedly fell by 38 %.
Analysts at UBS and William Blair viewed the new study results positively, but pointed to the high expectations leading up to the announcement. Data on overall survival and efficacy against other types of cancer are still outstanding and will be relevant to the vaccine’s further development. Before the results were released, Moderna shares had risen more than fivefold since the beginning of the year. Some wikifolio traders have now played it safe and sold their holdings.
TRADING-SENTIMENT
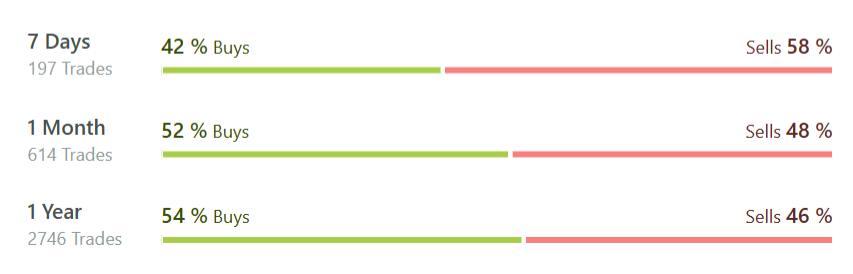
Gerald Asamer realised a small loss in his wikifolio Global News and Trends. “The sell-off seems to indicate disappointed high expectations or profit-taking rather than a failure of the study. Since the market is currently selling off even positive news ruthlessly, the position was sold today.” The trader analyses news and global trends to make investment decisions on as sound a basis as possible. He uses chart analysis as a supporting analytical tool. With an investment horizon that is predominantly short to medium term, he continually reviews how the news flow affects individual positions. That approach has now had consequences for Moderna. The portfolio was launched in March 2023. Since then, the trader has increased its value by 222 % (38 % p.a.), with a maximum drawdown of just over 20 %. The wikifolio has so far performed above average on risk metrics.
Chart
Disclaimer: Every investment in securities and other forms of investment is subject to various risks. Explicit reference is made to the risk factors in the prospectus documents of Lang & Schwarz Aktiengesellschaft (Final Terms, Base Prospectus together with supplements and the Simplified Prospectuses, respectively) at wikifolio.com , ls-tc.de and ls-d.ch. You should read the prospectus before making any investment decision in order to fully understand the potential risks and rewards of the decision to invest in the securities. The approval of the prospectus by the competent authority should not be construed as an endorsement of the securities offered or admitted to trading on a regulated market. The performance of the wikifolios as well as the respective wikifolio certificates refers to past performance. Future performance cannot be inferred from this. The content of this site does not constitute investment advice or a solicitation to buy or sell securities. This applies in particular to countries in which such an offer to buy or sell is not permitted. For further information, please refer to our General Terms and Conditions.


