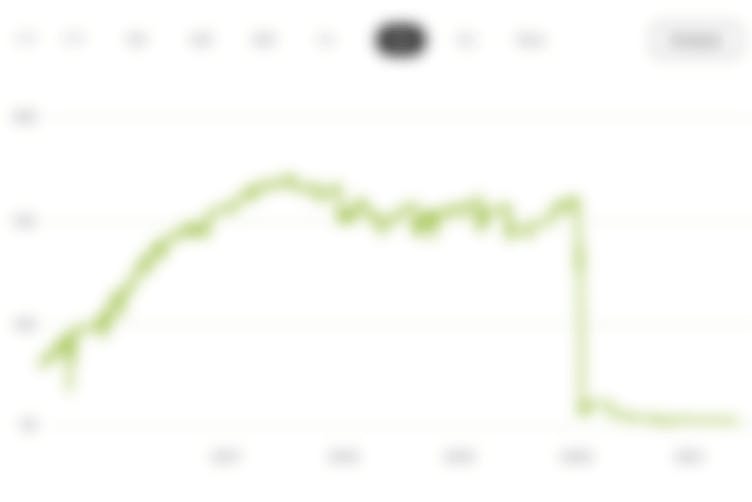
+9.5%
since 8/31/2019
+2.0%
Ø-Perf. per year
+21.4%
Performance (1yr)
18.7%
Volatility (1yr)
0.1
Return/Risk
Portfolio chart
DetailsTags
Feed
Trading Idea
Contrarian investment strategy, decicions for buying and selling are made based on the overbought and oversold status of the stocks. Used indicators are the MACD and the RSI. Divergence of indicators and actual stock prices are also used for trading decisions. In addition the we use the trends and violations thereof for timing the trades.
Master data
Symbol
WF0SNOOPY9
Date created
08/31/2019
Index level
-
High watermark
109.2